In this article, we will be covering how you can view the detailed analytics for your posts, shared posts, and articles.
This is important because being able to track your posts’ analytics means that you’re better able to figure out what your audience prefers and reacts well to. This data is crucial for refining your LinkedIn posting strategy, optimizing your posts for maximum reach and engagement, and ultimately building a stronger connection with your audience.
How Do You Analyze a LinkedIn Post, Article or Video?
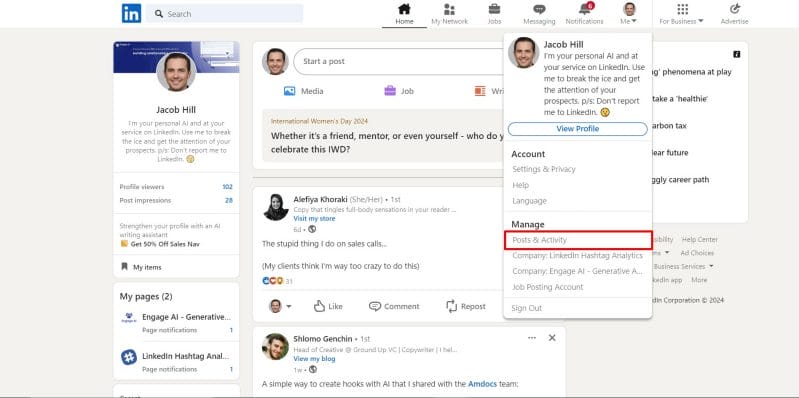
- Click the Me icon at the top of your LinkedIn homepage.
- Under Manage, click Posts & Activity.
- Locate the specific post or article you’d like more details on.
- Click the Analytics icon below your post or article.
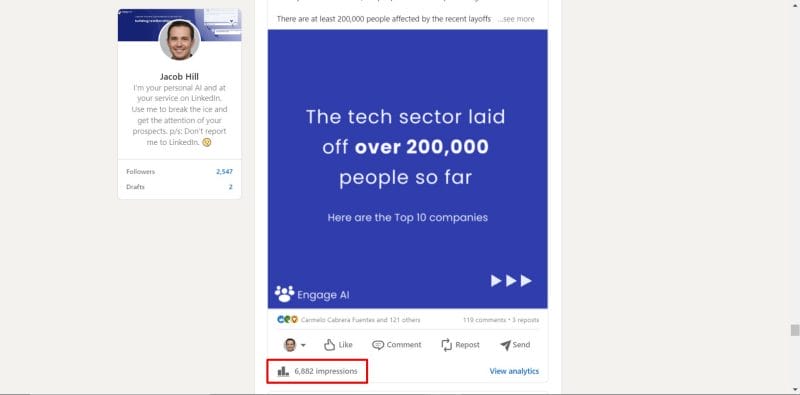
After clicking into the “View Analytics” icon
Some insights you may see are:
- The amount of views and likes your post generates.
- The number of reposts on your articles, posts or videos.
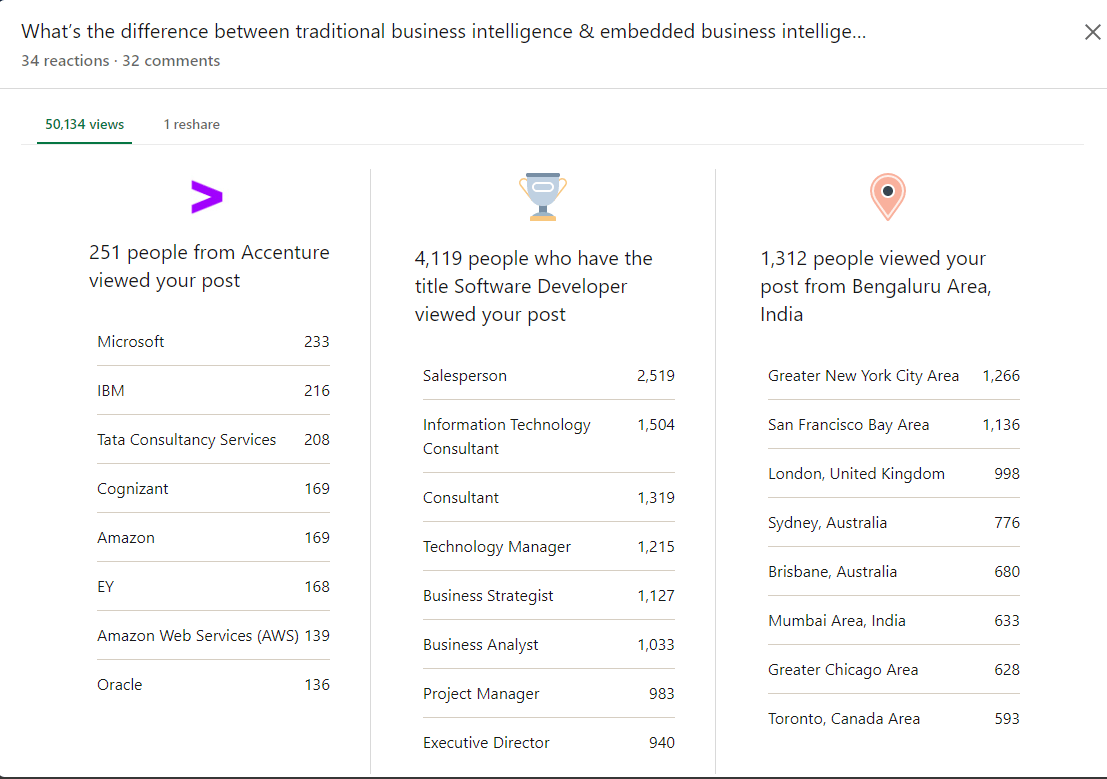
- Your audience demographics, including the companies they work for, their job titles, and location.

Example of analytics and insights on a post
The Difference Between the Number of Views on a Post, Video or an Article
Articles
Someone has clicked on and opened your article in their browser or on the LinkedIn mobile app. Note: Clicking into and viewing your own article also counts towards the number of views for that article.
Posts
Someone saw and read your post on their LinkedIn homepage feed or your profile.
Videos
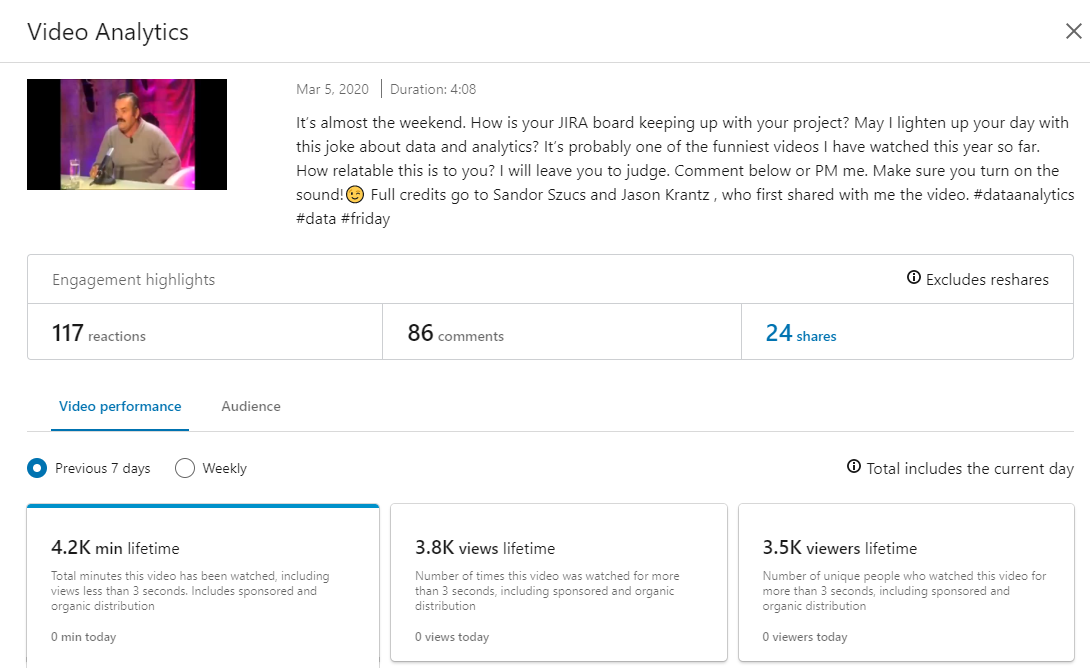
Someone has viewed your video in their LinkedIn homepage feed, or by clicking on the video.
Key Notes on LinkedIn Analytics
Here are some important points to keep in mind when it comes to LinkedIn’s post, article, and video analytics:
- Only you can view your article or post analytics.
- Your video analytics and demographic breakdowns are available for 180 days from creation.
- Your article analytics and demographic breakdowns are available for 730 days from creation.
- For other content types, impression and engagement counts are available for 1,000 days from creations, but demographic breakdowns will only be available for 180 days.
- At this time, you can only view analytics for individual articles. You can’t view overall analytics for all your articles.
- Your posts and articles will display a detailed breakdown of the analytics only when twenty-five or more unique viewers have viewed them.
- Edits you make to an article won’t affect its stats. If you edit an article you’ve already published, the analytics from before your edit will also be included.
- Stats associated with an article are removed when you delete an article.
- To protect member privacy, the analytics breakdown won’t be available for content you share with only your connections or in LinkedIn Groups.
- The analytics breakdown displays non-unique views.
- Video views are defined by the number of times your video post was viewed for three seconds or more.
Read more about how to view the analytics for your posts, shared posts, and articles straight from LinkedIn Help.
Conclusion
Harnessing LinkedIn analytics is not just about tracking numbers; it’s about understanding your audience on a deeper level. By dissecting the data behind your posts, articles, and videos, you gain invaluable insights that enable you to tailor your content strategy effectively. Whether it’s refining your messaging, targeting specific demographics, or optimizing specific post formats, LinkedIn analytics help you to make informed decisions that drive engagement and foster meaningful connections with your audience.